MGG Launches New Data and a Redeveloped Mapping Visualization
The entire team at Mapping the Gay Guides is excited to announce the release of a new dataset and the launch of a rebuilt mapping visualization.
Our new dataset brings another 25,000+ entries to our map from the years 1981 to 1985. Each year the Damron Guides expanded further to include new locations, new amenities, and new types. During this period, we see the addition of new amenities but we also see new types of locations beginning to appear which is, in part, reflective of the beginning AIDS crisis. For example, the number of health clinics in the country grow not only in size but begin to appear in areas of the country that didn’t previous have a health clinic. In 1981 Damron lists just a single health clinic in the entire country, in San Francisco. By 1985 the guide lists 10 clinics in 9 different cities - a dramatic increase and a reflection of the growing severity of the AIDS crisis. This data is full of rich and interesting trends and we’re beyond excited to share it with the public.
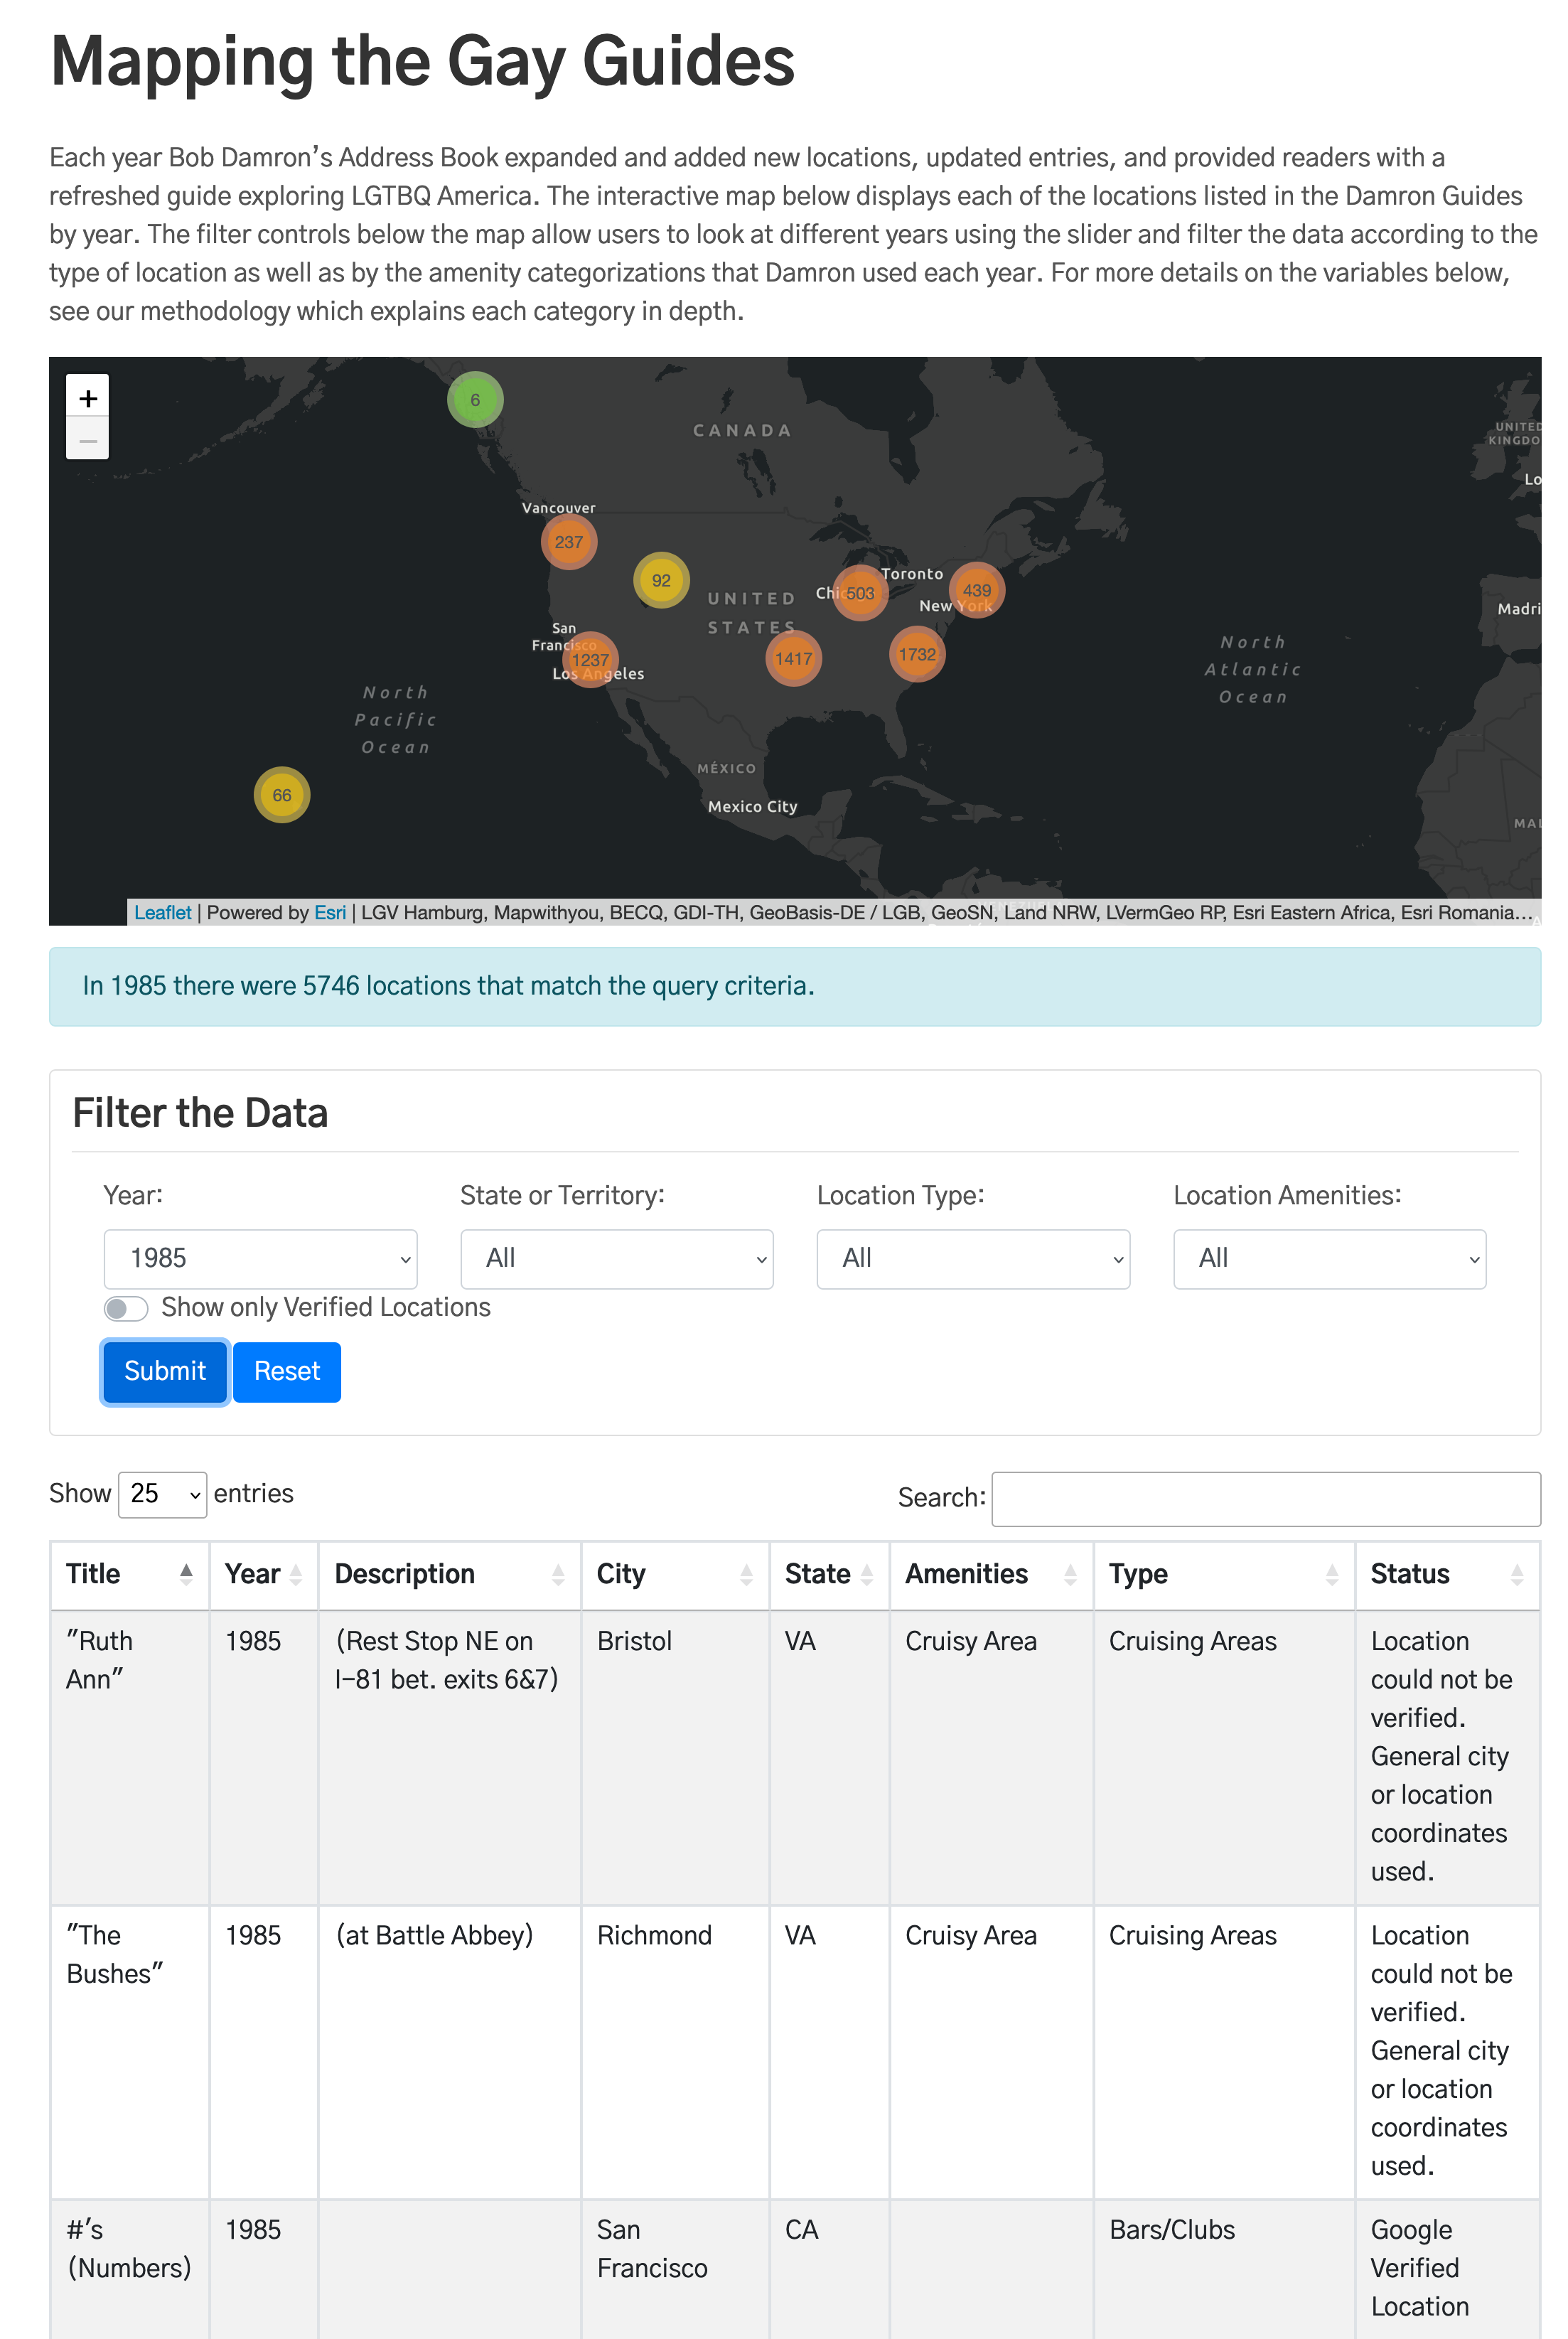
We are also releasing a new mapping visualization that has been rebuilt from the ground up. We expect to add another 100k location over the next year and a half and therefore we’ve rebuilt the visualization with that in mind. The map features all of the same filtering tools but in a new layout that asks users to submit a query of the data. The data table is also now searchable. With the architecture for growth in place, the MGG team will be regularly introducing new data and new features to this map over the next year.
We’d be remiss to announce the release of this data without thanking all the people who made this possible. Our GRAs at CSU Fullerton, Justin Cesario, Darius Faulk, Marisol Rivera, and Dianna Barahona Carrillo did the amazing work of transcribing these 25k+ entries. At Clemson University Dominick Bucca, Daniel Byrd, and Lucas Avelar all contributed to making sure this data is as clean as possible and that the new visualization works as expected. The Clemson Center for Geospatial Technologies offered support for hosting the MGG Data in ArcGIS. Finally, this project has been made possible due to the generous support of the National Endowment for the Humanities.
As always, you can interact with this new data in a couple ways. You can view the new map and examine the data through that visualization or you can view the raw data on our github repository.