Introducing Mapping the Gay Guides 2.0
By Amanda Regan and Eric Gonzaba
We are thrilled to announce the launch of Mapping the Gay Guides 2.0, the most significant expansion of our project since we first went live in 2020.
When we launched the original Mapping the Gay Guides, the site included approximately 34,697 listings from Bob Damron's Address Books spanning 1965 to 1980. Today, we're releasing a dramatically expanded and redesigned site that adds 147,044 new listings and extends our coverage through 2003. Our site now covers nearly four decades of LGBTQ life across the United States.
This update is the culmination of years of work by a dedicated team of scholars and graduate students who digitized, transcribed, cleaned, geocoded, and verified tens of thousands of entries by hand. It represents a fundamental rethinking of how users can explore and interact with the data contained in the Damron guides.
Here's a look at what's new.
What's New in 2.0
- 147,044 new listings added to the dataset, extending coverage from 1965 through 2003
- Redesigned website with new entry points for researchers and the general public
- Updated database with the ability to sort and filter by year, state, and amenity category
- New amenities visualization that allows users to examine how amenities changed over time
- New amenity guide describing each of Damron's amenity categorizations with historical context
- New methodology page detailing how this database was built and offering considerations for using the visualizations and data
An Expanded Dataset
The most significant change is the sheer scale of new data. The original site covered sixteen years of Bob Damron's Address Books (1965–1980). With the support of the National Endowment for the Humanities, we have digitized and transcribed an additional twenty-three years of guides, bringing our dataset through 2003. The result is a dataset that now contains over 181,000 listings and spans nearly forty years—from the mid-1960s, when homosexuality was illegal in nearly every state, through the early 2000s, as the internet was beginning to reshape how queer people found community.
This expanded timeline captures some of the most transformative periods in LGBTQ American history: the post-Stonewall movement of the 1970s, the devastating impact of the AIDS crisis in the 1980s, the emergence of new advocacy organizations, and the dramatic growth and eventual contraction of queer commercial spaces as online life took hold.
A Redesigned Website
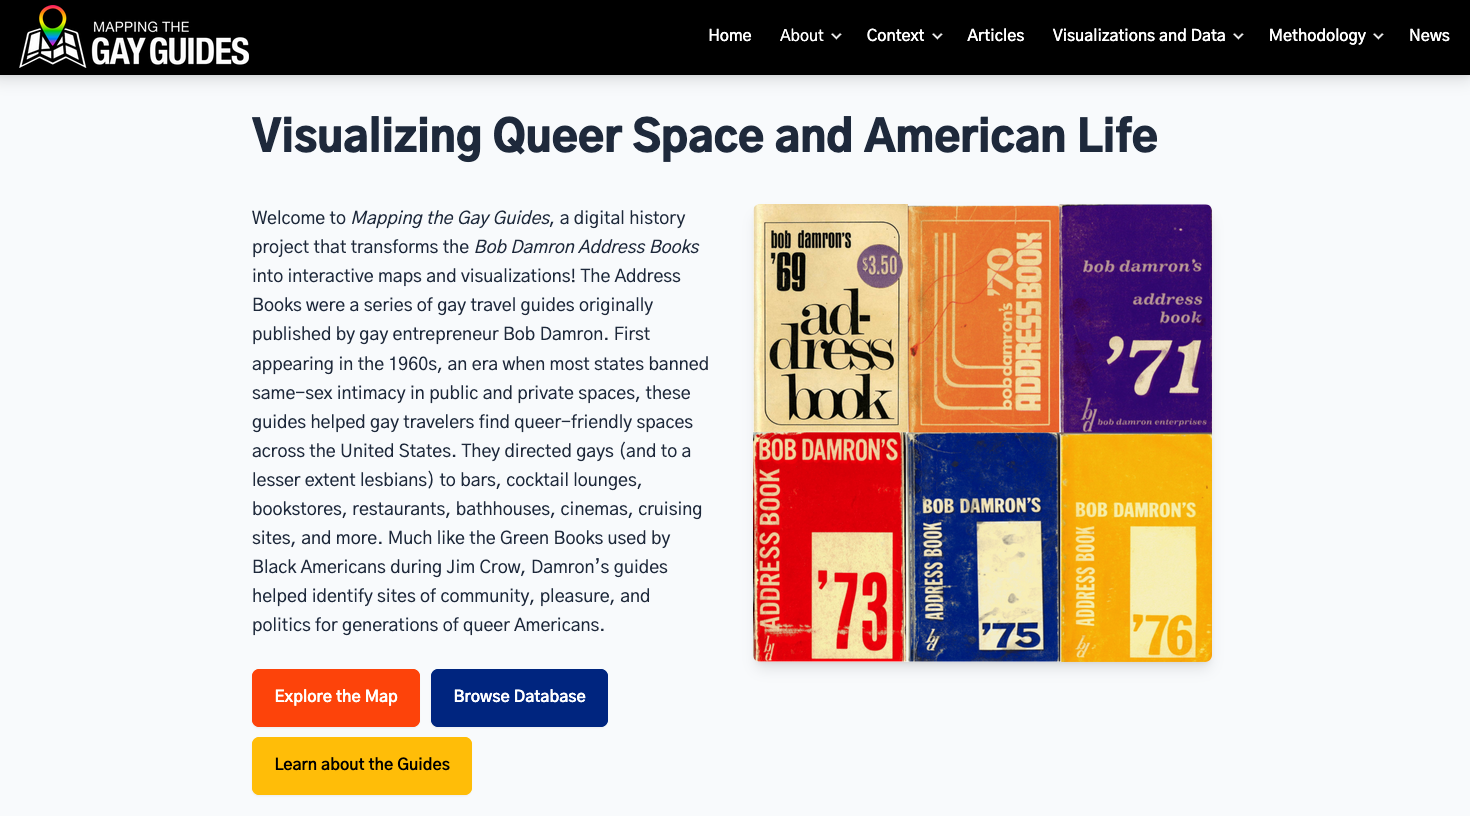
We’ve completely redesigned the site to make the data more accessible to a wider audience. The new homepage introduces the project and the Damron guides for first-time visitors while providing clear pathways for researchers who want to dive directly into the data. Whether you're a scholar interested in studying LGBTQ geographies, a local historian looking for information about queer spaces in your community, or someone curious about the history behind these remarkable travel guides, the new site offers multiple ways in.
Updated Database
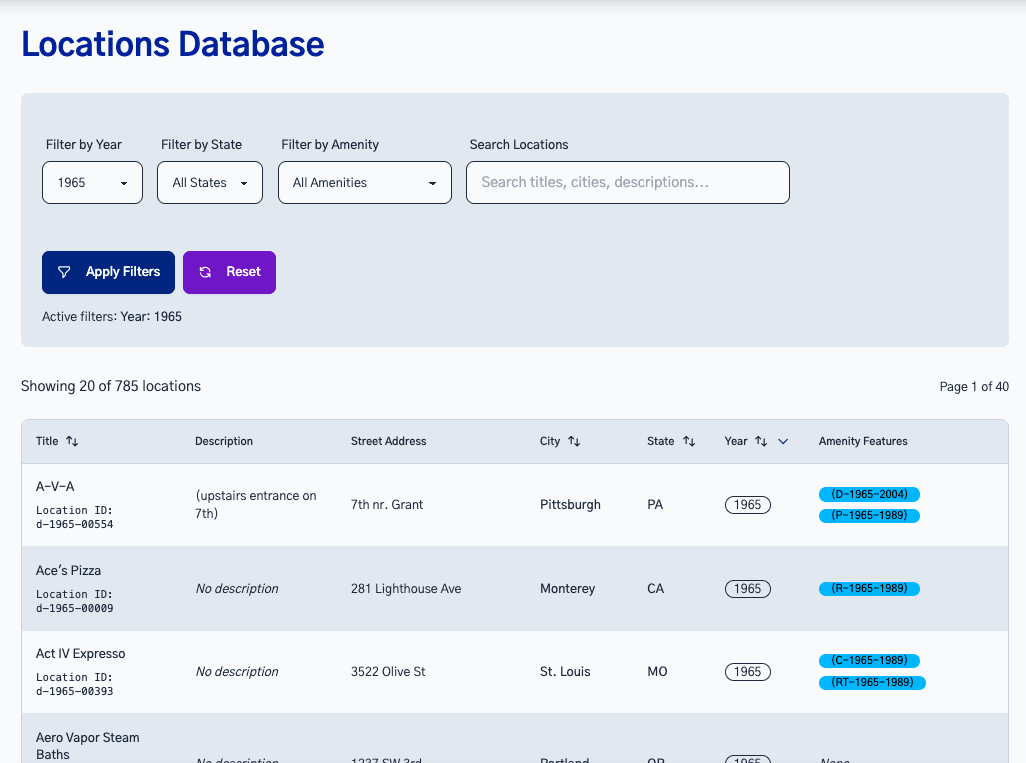
The new database interface allows you to search, sort, and filter through all locations in our dataset. You can narrow results by year, state, and amenity category to find exactly the information you need. Each entry displays the location's name, description, address, and all associated amenity features as they appeared in the original guides. In keeping with our commitment to open source historical data, the data can also be downloaded from our GitHub repository for those who want to reuse it in their own research.
Amenities Visualization
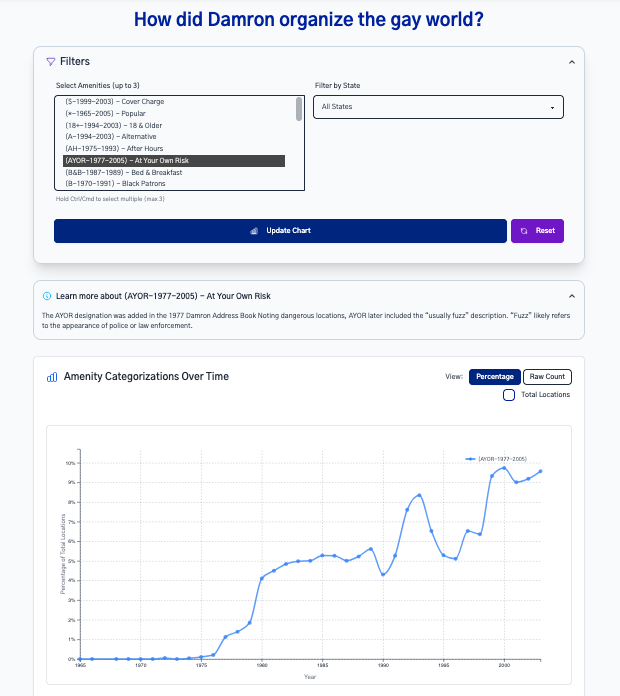
One of the features we’re most excited about is the new amenities visualization. This interactive tool allows users to track how Damron's amenity categorizations changed over the nearly four decades covered by our dataset. You can compare multiple amenities simultaneously, view data as percentages or raw counts, and explore geographic distributions. Want to see how listings for wheelchair-accessible venues grew after the passage of the Americans with Disabilities Act in 1990? Curious about changes in spaces categorized as welcoming to women? The amenities visualization makes these kinds of questions explorable in ways that would be nearly impossible with the raw data alone.
Amenity Guide
We've also added a new amenity guide that provides descriptions and historical context for each of Damron's amenity categorizations. The amenity features—the lettered codes Damron used to describe locations, like "(D)" for dancing or "(B)" for "Blacks Frequent"—are one of the most interesting and complex aspects of the guides. They changed over time, reflected Damron's own perspective and biases, and offer a unique window into how queer spaces were understood and categorized. The amenity guide helps users understand what these codes meant, how they evolved, and what they can tell us about LGBTQ history.
Methodology
Finally, we've published a comprehensive new methodology page that walks through the entire process of building this database—from digitization and transcription to geocoding and visualization. We've also included a discussion of considerations users should keep in mind when working with the data and visualizations on this site. We believe strongly in making our process transparent, and we hope this page will be a valuable resource for other digital history and humanities practitioners as well as for anyone using the data in their own research.
Acknowledgments
A project of this scale is only possible because of the contributions of many people over many years and we are grateful to the community of scholars who has supported this project since its inception.
First and foremost, we want to thank the National Endowment for the Humanities for their generous support of this project through the Humanities Collections and Reference Resources program. Their funding made it possible to digitize, transcribe, and process the twenty-three additional years of data that form the core of this expansion. Our program officer, Molly Hardy, was supportive of this project from the start.
We are also deeply grateful to the many graduate research assistants at California State University, Fullerton and Clemson University who served as essential collaborators on this project. Their painstaking work—transcribing entries by hand, cleaning data, verifying addresses, and geocoding locations—is the foundation everything on this site is built upon. Each of the more than 147,000 new entries passed through the careful hands of graduate students who devoted thousands of hours to this work over the course of several years.
We want to give a special acknowledgment to Lucas Avelar, a Digital History Ph.D. student at Clemson who worked as a Graduate Research Assistant on the project for two years. Lucas served as the project's Data Manager and his work was essential to producing and processing the more than 147,000 entries in this expansion. His dedication, attention to detail, and technical skill were invaluable, and this launch would not have been possible without him.
Finally, various institutions have supported this project in its various phases. Thanks to California State University, Fullerton, Southern Methodist University's Center for Presidential History, and Clemson University.